Prepared by: Tom Hengl (OpenGeoHub), Leandro Parente (OpenGeoHub), Luca Brocca (CNR), Gregory Duveiller (Max Planck Institute for Biogeochemistry), Martin Herold (GFZ), Santiago Ferrer (Vizzuality), Irene Eleta (Vizzuality)
The OEMC project was kick-started in June 2022. The first six months of the project were used to build a detailed implementation plan outlined in this document. The project aims to continuously develop and release a number of building blocks (back-end, front-end, software, and data solutions) components of pan-EU and global monitors that serve concrete use-cases i.e. diversity of user communities.
The main development principle of this cyberinfrastructure is that (a) it is a federated/decentralized system, (b) it is primarily based on FOSS and aiming at supporting open development communities, (c) it is user-centered hence improvements are based on interaction and feedback from users via 32 use-cases with concrete partners, and (d) it is an open data project based on FAIR principles.
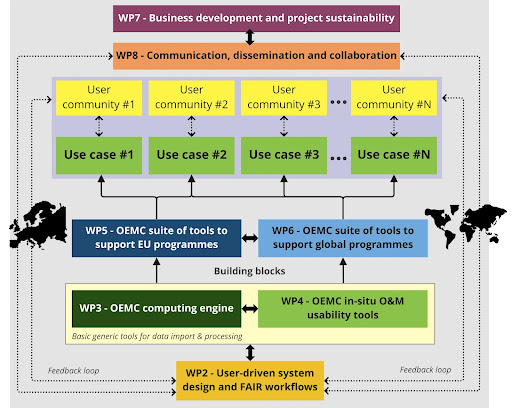
The key project deliverables in OEMC project will include (WP2) Stakeholder committee and user engagement plans throughout project duration; (WP3) Open-Earth-Monitor computing engine and geodata cube; (WP4) Open-Earth-Monitor in-situ (ground) data services; (WP5) Open-Earth-Monitor suite of tools directly serving EU citizens and governance needs via easy-to-use data portals and apps; (WP6) Open-Earth-Monitor suite of tools serving global governance needs.
Introduction
The Open-Earth-Monitor Cyberinfrastructure (OEMC) project (Horizon Europe funding 2022–2027) aims at increasing European capability to generate timely, accurate, disaggregated, people-centered, accessible (GSM-compatible) and user-friendly environmental information based on Earth Observation (EO) data. We plan to achieve this by building a cyberinfrastructure anchored in FAIR data principles, leveraging and improving our existing platforms e.g. OpenEO.org, Geopedia.world, GlobalEarthMonitor.eu, EarthSystemDataLab.net, OpenLandMap.org, EcoDataCube.eu, Geo-wiki, LifeWatch.eu, XCUBE and EuroDataCube.com. The project is coordinated by the OpenGeoHub foundation and is closely aligned with the broader EuroGEO initiative.
OEMC runs in three main phases:
- Implementation of the computing engine and in-situ O&M data services (2023–2025)
- Direct application of the Open-Earth-Monitor to support EU Green Deal and other strategic actions (2024–2026)
- Dissemination and engagement of stakeholders & target users through a series of open workshops, then revise the tools and adjust them to better fit their objectives and limitations (2023–2026)
We specifically target to contribute towards actions in the following directions:
- Operational planning for planting 3 billion trees over the EU by 2030;
- Achieving climate neutrality by 2035 in the land sector;
- Building back a net-zero GHG emission economy by 2050;
- Achieving UN’s SDGs’; monitoring essential biodiversity indicators;
- Compiling natural capital accounts for private/public sectors;
- Enabling businesses to leverage competitive advantage through the EU Green Deal;
- Increasing the quality of life for European Citizens.
The proposed OEMC system consists of three groups of components:
- [Humanware] Development teams: grouped around various tasks and aiming at co-designing, co-developing building blocks, and serving use cases. User communities can also be considered to be part of the human-ware. Currently, +100 people are directly involved in this project.
- [Dataware and Hardware] Data pools and back-end infrastructure: large datasets/databases and computing infrastructure either on 3rd hosting infrastructures or local infrastructures;
- [Software] Software libraries, APIs, front-end solutions: R, Python, or other libraries, computational tutorials, and UI toolkits for importing, processing, and serving environmental data at continental (EU) and global scales;
Dataware, hardware, and software are considered to be the building blocks of the system.
OEMC project in a nutshell
OEMC project is, in a nutshell, a FOSS-based federated solution producing open data and cost-effective data services aiming at supporting European Union programs. At the center of the project, i.e. the main focus of our work, are the so-called “Use cases” i.e. practical applications of the OEMC where the partner organizations and their users are at the center of the use-case-centered design. Use cases are jointly designed and implemented with 3rd independent parties that are continuously kept in the loop / invited to join conferences and workshops, and a part of the OEMC Stakeholders Committee. OEMC project, hence, largely follows the implementation design of the successfully completed E-shape and similar Horizon Europe projects under the EuroGEO umbrella.
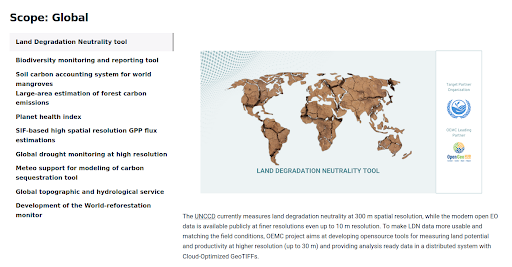
For comparison, the e-shape project had a total of 37 pilots, grouped around 6 major topics and strictly structured with objectives, development partners, targeted users/clients, expected outcome of the pilot, timeline of the pilot, nature of the outcome, means of release/means of access, user perspective, impact on the EO community at large, openness and sharing option, success stories clearly defined and tracked throughout the project. Likewise, the OEMC project has 32 use cases that will try to mimic the structure of the e-shape project as much as possible. Below is an example of one of the larger use-case conducted jointly with UNCCD.
Other important inspirations for the OEMC project design are the general software solutions enabling easier access and usability of data across formats and cloud-optimized such as GDAL and Cloud-Native geodata formats, reproducible computational notebooks such as Jupyter notebooks and Rbookdown documents, Geo-wiki and Mastodon-type solutions for large networks of open development communities. Here especially Mastodon (2.5 million users and about 10k servers based on data from June 2023), which is a free and open source microblogging network built as a decentralized federation of independently-operated servers, is picked as the ideal model for organizing geodata-producing communities.
Main development principles in OEMC project
The project development team has agreed to adhere to some minimum general development principles. The four most important development principles are that: (a) it is a federated/decentralized system, (b) it is primarily (or solely) based on FOSS, (c) it is a user-centered system hence improvements are based on interaction and feedback from users, and (d) it is an open data project based on FAIR principles.
The system development will be also based on the following three key premises:
- We aim at building & serving analysis/decision-ready data: To increase usage of environmental information it should be distributed as what users consider as decision-ready data or (at least) analysis-ready data. Most current users of EO data have neither the expert domain capacity nor often the interest, to prepare data until it can be freely and easily used for complex analysis or used directly to serve decision-making. In addition, users do not require 3 or 4 overlapping datasets (e.g. Landsat, Sentinel, Proba-V land products), but ideally would prefer a single harmonized, complete, consistent, current, and rapidly updatable dataset. See for example the benchmarking dataset we prepared for the purpose of testing gap-filling algorithms. Another important aspect of decision-ready data is that the EO-pixels can directly relate to bottom-up information from national or regional censuses and statistical offices.
- We aim at producing economically-assessed environmental information: Climate action or any similar large-scale environmental management/restoration will struggle until most citizens are aware of the financial benefits and co-benefits of ecosystem services. We believe that environmental information needs to be extended to include societal benefits generated by ecosystem services or costs of environmental pressures. Often, though not always, monetary information is easier to apply, for example, by users from the business community. In other words: Climate and Biodiversity Action will not be undertaken unless financial benefits and co-benefits are (more) clear.
- Our data solutions are user-centered: Users, i.e. people, should be central to co-designing a system and ought to be involved from the start of the implementation phase. We promote a hybrid bottom-up/top-down approach that would put users at the center of design, without losing on the speed and efficiency of development. In the hybrid approach, prototype “top-down products” are presented mid-way through the project to users for evaluation/recommendations. Users might not be fully aware of what can be done, but once they see it, they can express preferences, suggestions, and requirements, and get engaged with producing the final “bottom-up products”.
Main project outputs
The OEMC system will deliver a number of outputs that can be classified as:
- New software solutions to help implement deliverables and especially to serve WPs 3–6. This can be and/or:
- New or updated existing R, Python, Julia, and OSGeo libraries
- Functions and services served through API; new standards e.g. for monitoring terrestrial biomass (see e.g. Labrière et al., 2023)
- Front-end solutions: passive and/or interactive apps, web-mapping portals, and dashboards.
- New value-added datasets at high spatial resolutions and served as Cloud-Optimized Analysis-Ready data that will serve as a demonstration of the functionality and added value of combining Machine Learning (ML) as implemented in FOSS with massive environmental and EO datasets. This can be and/or:
- Vector (point, line, polygon) data: most importantly we will generate standardized, analysis-ready training data representing Observations & Measurements (O&M) from federated networks (see e.g. Calders et al., 2023), including citizen science data (Fraisl et al., 2023), that can be used to run machine learning and produce value-added decisions-ready / analysis-ready datasets. This data will be entered into geospatial DBs and/or served through S3 via Cloud-Optimized formats e.g. Flatgeobuf, Geoparquet, or similar.
- Gridded Spatiotemporal datasets (usually complete, consistent time-series of COGs or zarr files) at various spatial resolutions (10, 25, 30, 100, 250, 1000 m) and various temporal support (daily, weekly, monthly, annual, long-term) covering the bounding box/mask of interest defined in the project (pan-EU and global, with special focus on Tropics).
- Sample datasets i.e. smaller subsets that are used for testing and demo purposes. Small datasets will be best distributed in simple tabular formats e.g. as Simple Features or multiarray with spatiotemporal coordinates of the center of pixels;
- Scientific materials: registered with a DOI and citable in the literature. This includes:
- Peer-reviewed scientific and technical publications
- Blog posts
- Lectures and demonstrations (multimedia materials)
- Use cases: demonstration of OEMC in action for solving real-life problems, serving concrete stakeholders, then receiving feedback and re-design, re-build, and re-publish improvements;
You can follow the project outputs continuously via:
- Summary of all outputs: https://earthmonitor.org/outputs/
- Datasets: https://zenodo.org/communities/oemc-project/
- Publications: https://scholar.google.com/scholar?q=101059548
- Video-materials: https://av.tib.eu/publisher/OpenGeoHub_Foundation
- Code/software development: see respective profiles on Github and Gitlab per partner organization
Each project output would need to follow some minimum quality criteria and good practice guidelines. The minimum standards include:
- Required data and software licenses are used (also following the Consortium Agreement).
- An official file naming system is used.
- Standard recommended vocabularies (codes, variables names, keywords) are used.
- Files are uploaded and/or registered using official registries/project management systems.
- Complete metadata is provided passing a minimum (automated) check via Geonetwork and/or STAC.
- Software and data outputs are following the project specifications. They pass validity checks as specified in the minimum requirements column.
- For each output, a support channel is available (GitHub, GitLab support channels, or similar) where users can ask questions and register eventual bugs/issues.
- New attached publications + DOI’s (i.e. how to cite data is specified) are registered in the OEMC catalogs.
The key project deliverables in the OEMC project will include:
- (WP2) Stakeholder committee and user engagement plans throughout the project duration
- (WP3) Open-Earth-Monitor computing engine and geodata cube
- (WP4) Open-Earth-Monitor in-situ (ground) data services
- (WP5) Open-Earth-Monitor suite of tools directly serving EU citizens and governance needs via easy-to-use data portals and apps
- (WP6) Open-Earth-Monitor suite of tools serving global governance needs
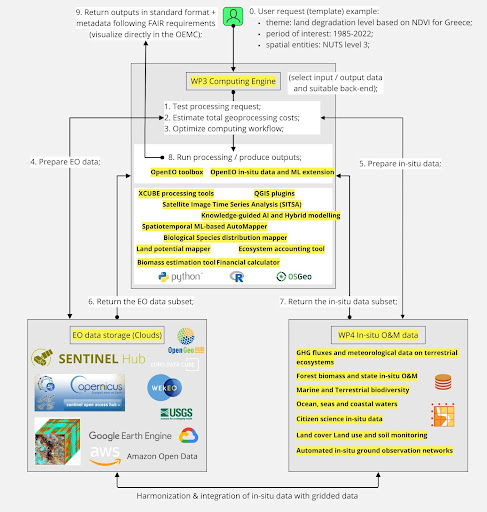
The back-end components Open-Earth-Monitor computing engine (WP3) and in-situ O&M data service are imagined here as the core functional components, i.e. building blocks, of the cyberinfrastructure that will ultimately support producing the most accurate and most complete and consistent analysis-ready data, which can then be shared via WP5 and WP6 (see complete list of monitors below). They might be made available to external parties in the later part of the project including as commercial services to ensure quality and sustainability.
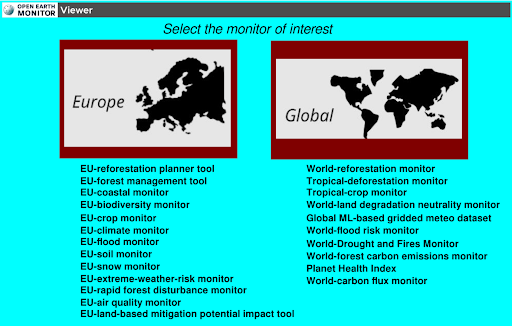
OEMC monitors will be implemented as a 3-tier system:
- Tier 1: the central EarthMonitor.org App/viewer with quality-controlled layers and monitors
- Tier 2: partner-based monitors and building blocks (federated approach)
- Tier 3: on-demand monitors that users can build rapidly with few lines of code i.e. by using out-of-box FOSS solutions such as G3W, Lizmap, xcube viewer, Rshiny apps or similar
The Tier 2 building blocks (e.g. Xcube viewer for EarthSystemDataLab.net, OpenLandMap, OpenEO.cloud editor, EuroDataCube.com, Geo-wiki, Geopedia.world, EcoDataCube.eu and similar) are at the center of the development. Selection of the successfully produced layers and solutions in Tier 2 are then integrated into a single seamless system: the central EarthMonitor.org App. Consider for example the predictions of the future vegetation (biomes) described in Bonannella et al. (2023). The most extensive version of the data is hosted on OpenLandMap.org, while a selection of layers that can support on-the-ground activities / serving specific use-cases and partner organizations, will be added to the World-reforestation monitor (WP6) and will be made available in combination with other layers from Tier 2 stream.
The EarthMonitor.org App (central landing page) will be a cloud-based service with robust and secure back-end and front-end, and with data being updated on an annual, monthly or in some cases even weekly basis. The EarthMonitor.org App will be accessible from a single landing page (a professional and user-experience-designed GUI) via a single robust visualization framework i.e. a single landing page. The users will be able to directly engage with so-called “geo-stories” comparable to the Geostory extension in GeoNode. The geo-stories will be self-explanatory and allow users to seamlessly visualize and experience spatial and temporal trends, events, and effects of scenario testing. Their main purpose will be to quickly inform, explain and engage visitors regardless of their level of expertise.
What is an “Environmental monitor”?
One of the main objectives of the OEMC project is to build a number of environmental monitors to serve concrete organizations / European Union programs. But what is a “monitor”? In the EO context, an environmental monitoring system typically implies a back-end front-end solution serving decision-ready data e.g. through a web-GIS + dashboard, and which shows current, past, and/or future states of the environment and environmental events potentially affecting the quality of life of citizens and/or living beings. The main targeted uses of an EO-based monitoring system are usually:
- To help raise awareness / warn users of potential negative trends, unexpected events, and natural hazards or risks (hence we use geo-stories)
- To provide the most up-to-date information in a seamless visualization framework easy to interpret by the general public (ideal case) or at least by targeted professionals
- To serve as an objective basis for decision making i.e. as a support to local, national, and confederal governments
- To serve as input to statistical offices to register and archive events
Typical examples of EO-based monitors include e.g. (unsorted):
- Copernicus Emergency Management System / the European and Global Drought Observatories (EDO and GDO);
- The European Forest Fire Information System (EFFIS);
- ESA’s Air pollution monitoring based on the Sentinel-5 satellite;
- NASA’s Global Climate Change Watch;
- USGS Latest Earthquakes – Map;
- NOAA’s Coral Reef Watch;
- European Atlas of the Seas / Maritime Atlas;
- Global Forest Watch (WRI);
Currently, no single system in the world exists where users can track all aspects of the environmental dynamics across borders. In fact, for many environmental processes, we are potentially not even aware of the trends, main drivers of dynamics or events nor is there any decision-making/response. For example, we still know relatively little about land degradation, causes of loss of biodiversity/hotspot locations of the biodiversity decline and why and where exactly some insect species e.g. bees are disappearing the most. OEMC is trying to bridge this gap, especially by demonstrating that distributed data can be seamlessly integrated into data dashboards and used to raise awareness and help support decision-makers.
Environmental monitoring systems can be classified based on three main aspects: (1) the main type of monitoring, (2) the main natural resource of interest, and (3) spatial and temporal coverage. In the OEMC project, we also refer to the following classification system of monitors:
- Based on the nature of the monitoring target:
- Human-caused-events-based monitors: focusing on distinct events caused by individuals /human activity such as oil spills, industrial pollution, a distinct change of land use, clear-cuttings / unregulated deforestation (Camara et al., 2023), etc.
- Natural-hazard-events-based monitors: focusing on distinct natural events e.g. outbreaks of diseases, fires, earthquakes, and flood events.
- Ecosystem health monitors: focusing on longer-term processes, continuous activities, and transitions e.g. climate change, air and litter pollution, loss of biodiversity etc.
- Socio-economic monitors: focusing on how socio-economic processes and events (including political decisions and are hence country-based) impact environmental dynamics for example night-light dynamics.
- Based on the main resource of interest / main theme (these can be multiple applicable but one can be considered to be the main theme):
- Biodiversity;
- Forest resources;
- Soil resources;
- Fresh-water resources;
- Atmospheric resources;
- Oceans and seas;
- Mineral and geological resources;
- Based on the temporal coverage:
- Real-time;
- With daily to weekly updates;
- With monthly to seasonal updates;
- With annual updates;
- Based on spatial coverage:
- Global;
- Continental / regional;
- National;
- Provincial/local;
What makes an effective “environmental monitoring system” i.e. an effective dashboard UI? We recommend the following minimum checklist:
- Users with no GIS skills should be able to engage with geo-stories. A possible solution is that users can directly run an animation telling a geo-story as in e.g. Google Earth Engine time-lapse.
- Users can see information about data sets. E.g.: text blocks explaining where does the data come from, how to interpret it
- Geo-stories are relevant and user-centered i.e. they are optimized based on the user requirements. A possible and partial solution is to track traffic (e.g. most visited geo-stories/best-ranked geo-stories are listed at the top making it easier to users to navigate through content);
- All content is provided in a way that allows users to share it, save it, and embed it in their own blogs/websites. A possible solution is to use the OEMC URL bookmarking system.
- Users should be able to easily orient themselves in the monitors and customize visualization. Possible solutions: spatial layers are combined with background maps and training ground-truth O&M; basic visualization tools such as transparency, slider-map-comparison, animation, and effects, are seamlessly integrated into the dashboard.
Advanced users can also access data in professional data catalogs and download it for their own purpose, which can be achieved through automatically generated cross-links.
How can the OEMC project help you with your work?
If you are producing global or pan-EU environmental monitors, especially if you are aiming at producing and maintaining open geodata that can be used to raise awareness and help reach people on the ground, we could potentially host your data on our infrastructure. Please contact the project lead via: https://earthmonitor.org/contact-us/ and let us know about your project and how you think we could help you.
If you are looking for commercial solutions i.e. customize services that you can use potentially within days or weeks, please contact directly our commercial partners in the consortium:
- Sinergise.com / Sentinel-Hub
- Brockman Consult / EuroDataCube.com
- Vizzuality.com
- GILAB.rs
- TerraSigna.com
OEMC project in 2023/2024
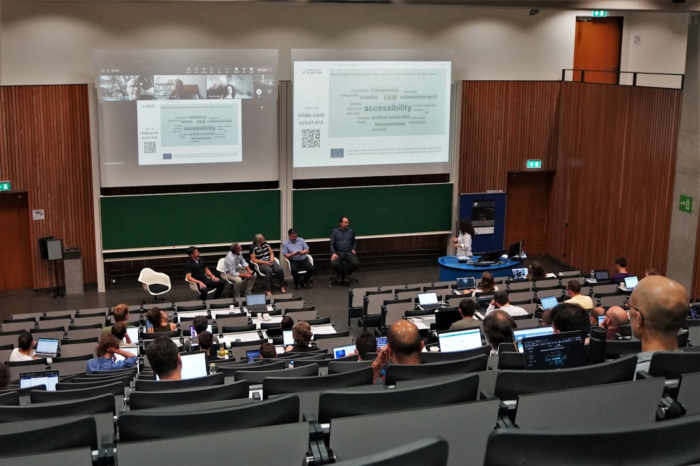
What to expect from this project in 2023/2024? We are planning a number of workshops and hackathons at the Open-Earth-Monitor Global Workshop 4–6 October 2023, Eurac Earth Observations Institute, Bolzano (Italy) “Connecting open EO solutions to boost European and global goals”. Come and meet the consortium and interact with the key developers and components of the systems. Help us build better software and data for global good!
*For the most complete version of this document, we invite you to read it on Medium*